This website related to the Bay Area Rapid Transit (BART), a mass rapid transit system serving the San Francisco Bay Area, is under construction. When completed, it will contain some historical information on BART ridership (taken from the BART ridership reports page), station data, and fares and schedules (taken from the current version and historical versions of the fares and schedules booklet). You can see the underlying code for this website and the SQL insertion commands for the database it uses at the GitHub repository.
NOTE: Due to rounding, entry and exit counts where either station is "all stations" may not match the source data precisely. It'll be off by at most the number of stations, and usually by a lot less.
The website is managed by Vipul Naik. It is not in any way affiliated with Bay Area Rapid Transit (BART) as an entity.
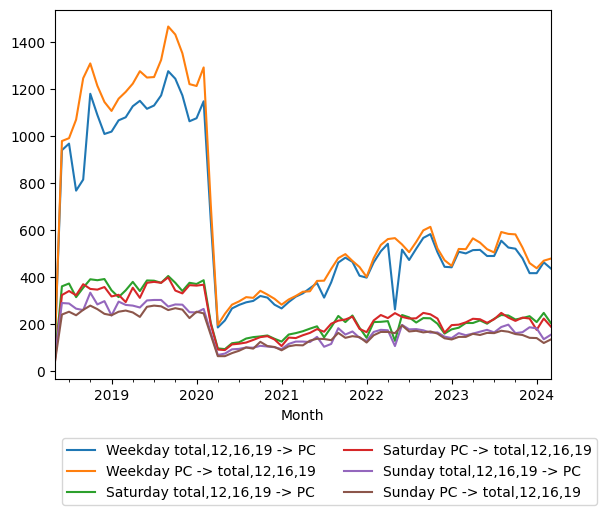
| Year | Month | Weekday total,12,16,19 -> PC | Weekday PC -> total,12,16,19 | Saturday total,12,16,19 -> PC | Saturday PC -> total,12,16,19 | Sunday total,12,16,19 -> PC | Sunday PC -> total,12,16,19 |
|---|---|---|---|---|---|---|---|
| 2024 | 03 | 436 | 478 | 204 | 189 | 154 | 134 |
| 2024 | 02 | 462 | 469 | 247 | 223 | 135 | 119 |
| 2024 | 01 | 416 | 437 | 208 | 175 | 181 | 140 |
| 2023 | 12 | 416 | 459 | 233 | 223 | 186 | 141 |
| 2023 | 11 | 479 | 525 | 225 | 227 | 165 | 153 |
| 2023 | 10 | 520 | 581 | 219 | 213 | 161 | 157 |
| 2023 | 09 | 525 | 583 | 236 | 227 | 197 | 167 |
| 2023 | 08 | 554 | 591 | 238 | 247 | 187 | 171 |
| 2023 | 07 | 489 | 504 | 222 | 220 | 164 | 161 |
| 2023 | 06 | 489 | 518 | 201 | 205 | 175 | 162 |
| 2023 | 05 | 515 | 546 | 215 | 220 | 167 | 153 |
| 2023 | 04 | 514 | 564 | 204 | 222 | 159 | 158 |
| 2023 | 03 | 500 | 518 | 204 | 207 | 152 | 145 |
| 2023 | 02 | 507 | 519 | 184 | 197 | 161 | 145 |
| 2023 | 01 | 441 | 447 | 177 | 195 | 140 | 134 |
| 2022 | 12 | 443 | 471 | 159 | 163 | 146 | 139 |
| 2022 | 11 | 505 | 521 | 201 | 223 | 164 | 159 |
| 2022 | 10 | 582 | 613 | 224 | 241 | 163 | 168 |
| 2022 | 09 | 566 | 598 | 225 | 247 | 173 | 164 |
| 2022 | 08 | 520 | 549 | 206 | 224 | 178 | 171 |
| 2022 | 07 | 472 | 505 | 228 | 223 | 177 | 168 |
| 2022 | 06 | 516 | 538 | 238 | 230 | 196 | 194 |
| 2022 | 05 | 262 | 565 | 128 | 246 | 106 | 161 |
| 2022 | 04 | 541 | 561 | 212 | 225 | 173 | 166 |
| 2022 | 03 | 509 | 536 | 209 | 238 | 175 | 166 |
| 2022 | 02 | 462 | 480 | 208 | 215 | 166 | 152 |
| 2022 | 01 | 397 | 400 | 141 | 165 | 128 | 121 |
| 2021 | 12 | 405 | 442 | 184 | 179 | 141 | 144 |
| 2021 | 11 | 464 | 468 | 236 | 231 | 168 | 148 |
| 2021 | 10 | 482 | 497 | 208 | 219 | 155 | 141 |
| 2021 | 09 | 461 | 480 | 234 | 214 | 182 | 162 |
| 2021 | 08 | 377 | 434 | 186 | 201 | 115 | 131 |
| 2021 | 07 | 312 | 384 | 143 | 167 | 103 | 136 |
| 2021 | 06 | 374 | 383 | 190 | 178 | 145 | 137 |
| 2021 | 05 | 352 | 339 | 180 | 162 | 123 | 129 |
| 2021 | 04 | 330 | 337 | 169 | 152 | 125 | 109 |
| 2021 | 03 | 316 | 319 | 161 | 140 | 125 | 110 |
| 2021 | 02 | 293 | 304 | 155 | 142 | 115 | 105 |
| 2021 | 01 | 266 | 282 | 125 | 106 | 93 | 88 |
| 2020 | 12 | 282 | 307 | 137 | 134 | 101 | 102 |
| 2020 | 11 | 312 | 325 | 151 | 148 | 104 | 106 |
| 2020 | 10 | 319 | 341 | 147 | 144 | 107 | 124 |
| 2020 | 09 | 298 | 311 | 144 | 132 | 99 | 95 |
| 2020 | 08 | 292 | 314 | 138 | 121 | 100 | 100 |
| 2020 | 07 | 281 | 296 | 122 | 116 | 94 | 86 |
| 2020 | 06 | 266 | 282 | 118 | 113 | 92 | 76 |
| 2020 | 05 | 215 | 243 | 93 | 89 | 74 | 63 |
| 2020 | 04 | 185 | 196 | 96 | 91 | 68 | 63 |
| 2020 | 03 | 643 | 710 | 206 | 200 | 163 | 154 |
| 2020 | 02 | 1147 | 1291 | 386 | 367 | 264 | 245 |
| 2020 | 01 | 1075 | 1212 | 370 | 363 | 249 | 252 |
| 2019 | 12 | 1062 | 1220 | 375 | 365 | 250 | 225 |
| 2019 | 11 | 1172 | 1351 | 340 | 330 | 282 | 261 |
| 2019 | 10 | 1243 | 1431 | 375 | 342 | 283 | 267 |
| 2019 | 09 | 1275 | 1465 | 404 | 398 | 274 | 259 |
| 2019 | 08 | 1172 | 1323 | 375 | 375 | 302 | 275 |
| 2019 | 07 | 1129 | 1250 | 384 | 379 | 302 | 278 |
| 2019 | 06 | 1115 | 1248 | 385 | 375 | 300 | 273 |
| 2019 | 05 | 1149 | 1275 | 340 | 311 | 270 | 230 |
| 2019 | 04 | 1126 | 1222 | 379 | 354 | 278 | 249 |
| 2019 | 03 | 1079 | 1187 | 343 | 293 | 281 | 257 |
| 2019 | 02 | 1066 | 1158 | 314 | 324 | 295 | 252 |
| 2019 | 01 | 1018 | 1106 | 343 | 317 | 236 | 237 |
| 2018 | 12 | 1008 | 1144 | 391 | 357 | 297 | 243 |
| 2018 | 11 | 1089 | 1213 | 386 | 346 | 283 | 263 |
| 2018 | 10 | 1179 | 1308 | 390 | 349 | 333 | 278 |
| 2018 | 09 | 814 | 1245 | 354 | 369 | 259 | 260 |
| 2018 | 08 | 767 | 1069 | 314 | 322 | 265 | 237 |
| 2018 | 07 | 967 | 990 | 372 | 340 | 287 | 252 |
| 2018 | 06 | 939 | 978 | 360 | 323 | 289 | 240 |
| 2018 | 05 | 105 | 98 | 50 | 37 | 54 | 36 |
Printed data for 71 months (rows) and 6 columns, for a total of 426 entries
Total time taken: 2.168 seconds, 0.087 for query, 2.081 for graph, and 0.000 for display