This website related to the Bay Area Rapid Transit (BART), a mass rapid transit system serving the San Francisco Bay Area, is under construction. When completed, it will contain some historical information on BART ridership (taken from the BART ridership reports page), station data, and fares and schedules (taken from the current version and historical versions of the fares and schedules booklet). You can see the underlying code for this website and the SQL insertion commands for the database it uses at the GitHub repository.
NOTE: Due to rounding, entry and exit counts where either station is "all stations" or a set of more than one station may not match the source data precisely. When one side is "all stations" and the other side is a specific station, the numbers can be off by at most half the number of stations (so at most half of 50 = 25), and usually by a lot less (usually less than 10). When both sides are "all stations" the numbers can be off by at most half the square of the number of stations (so at most half of the square of 50 which works out to 1,250) and usually a lot less (usually less than 500). If you select a set of stations on one of both sides, the numbers can be off by up to half the product of the number of stations on the two sides, and usually by a lot less. These discrepancies are likely small relative to the intrinsic noisiness of the numbers and inaccuracies created by phenomena such as fare evasion.
The website is managed by Vipul Naik. It is not in any way affiliated with Bay Area Rapid Transit (BART) as an entity.
Permalink URL: https://bart.vipulnaik.com/ridership.php?entryStation=total&exitStation=ML
| Field name | Value for station ML |
|---|---|
| 2-letter code (used in ridership reports; see Station Name Abbreviations (XLS)) | ML |
| 4-letter code (used in APIs and on BART website) | MLPT |
| Long code (used in fares and schedules brochure) | MILPT |
| Ordinary name | Milpitas |
| Wikipedia page | https://en.wikipedia.org/wiki/Milpitas_station |
| BART page | https://www.bart.gov/stations/mlpt |
| Opening date | 2020-06-13 |
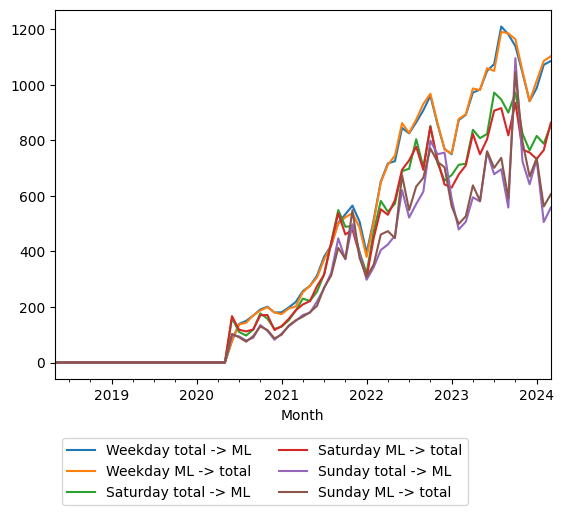
The graph and table below show average weekday, Saturday, and Sunday ridership between all stations and the station Milpitas (ML).
| Year | Month | Weekday total -> ML | Weekday ML -> total | Saturday total -> ML | Saturday ML -> total | Sunday total -> ML | Sunday ML -> total |
|---|---|---|---|---|---|---|---|
| 2025 | 04 | 1237 | 1268 | 858 | 846 | 658 | 697 |
| 2025 | 03 | 1051 | 1076 | 753 | 737 | 510 | 559 |
| 2025 | 02 | 1182 | 1184 | 785 | 766 | 520 | 566 |
| 2025 | 01 | 1142 | 1135 | 687 | 685 | 499 | 510 |
| 2024 | 12 | 1190 | 1176 | 764 | 744 | 671 | 709 |
| 2024 | 11 | 1272 | 1235 | 843 | 814 | 788 | 827 |
| 2024 | 10 | 1334 | 1354 | 992 | 980 | 1264 | 1239 |
| 2024 | 09 | 1363 | 1378 | 1023 | 1000 | 916 | 974 |
| 2024 | 08 | 1232 | 1266 | 960 | 974 | 964 | 937 |
| 2024 | 07 | 1313 | 1302 | 883 | 928 | 697 | 701 |
| 2024 | 06 | 1229 | 1271 | 962 | 1019 | 826 | 874 |
| 2024 | 05 | 1139 | 1198 | 774 | 796 | 590 | 622 |
| 2024 | 04 | 1108 | 1135 | 841 | 834 | 676 | 701 |
| 2024 | 03 | 1086 | 1103 | 856 | 864 | 558 | 606 |
| 2024 | 02 | 1072 | 1086 | 788 | 765 | 506 | 562 |
| 2024 | 01 | 988 | 1015 | 816 | 733 | 731 | 736 |
| 2023 | 12 | 941 | 941 | 764 | 756 | 642 | 670 |
| 2023 | 11 | 1043 | 1049 | 824 | 767 | 724 | 795 |
| 2023 | 10 | 1139 | 1164 | 972 | 935 | 1096 | 1046 |
| 2023 | 09 | 1182 | 1185 | 900 | 818 | 558 | 591 |
| 2023 | 08 | 1210 | 1191 | 947 | 916 | 696 | 737 |
| 2023 | 07 | 1075 | 1050 | 972 | 907 | 678 | 701 |
| 2023 | 06 | 1050 | 1060 | 823 | 804 | 758 | 761 |
| 2023 | 05 | 983 | 981 | 808 | 750 | 580 | 582 |
| 2023 | 04 | 972 | 987 | 838 | 823 | 595 | 638 |
| 2023 | 03 | 892 | 894 | 716 | 710 | 507 | 527 |
| 2023 | 02 | 873 | 877 | 712 | 677 | 479 | 499 |
| 2023 | 01 | 750 | 753 | 675 | 630 | 589 | 563 |
| 2022 | 12 | 769 | 767 | 655 | 641 | 756 | 703 |
| 2022 | 11 | 858 | 863 | 719 | 730 | 750 | 723 |
| 2022 | 10 | 961 | 968 | 852 | 849 | 799 | 771 |
| 2022 | 09 | 908 | 931 | 703 | 694 | 615 | 665 |
| 2022 | 08 | 865 | 875 | 804 | 777 | 571 | 634 |
| 2022 | 07 | 825 | 827 | 698 | 728 | 522 | 549 |
| 2022 | 06 | 845 | 862 | 689 | 694 | 621 | 674 |
| 2022 | 05 | 725 | 745 | 572 | 585 | 457 | 448 |
| 2022 | 04 | 717 | 712 | 543 | 532 | 425 | 473 |
| 2022 | 03 | 652 | 649 | 582 | 552 | 405 | 461 |
| 2022 | 02 | 514 | 507 | 471 | 449 | 343 | 353 |
| 2022 | 01 | 395 | 380 | 321 | 306 | 298 | 308 |
| 2021 | 12 | 508 | 486 | 398 | 389 | 395 | 377 |
| 2021 | 11 | 565 | 538 | 491 | 479 | 498 | 549 |
| 2021 | 10 | 534 | 523 | 489 | 461 | 372 | 373 |
| 2021 | 09 | 503 | 500 | 549 | 538 | 447 | 413 |
| 2021 | 08 | 422 | 422 | 433 | 430 | 323 | 313 |
| 2021 | 07 | 381 | 371 | 318 | 316 | 267 | 270 |
| 2021 | 06 | 313 | 306 | 255 | 275 | 220 | 204 |
| 2021 | 05 | 276 | 276 | 222 | 221 | 179 | 181 |
| 2021 | 04 | 257 | 253 | 230 | 209 | 171 | 165 |
| 2021 | 03 | 218 | 202 | 187 | 188 | 150 | 152 |
| 2021 | 02 | 198 | 194 | 152 | 157 | 130 | 133 |
| 2021 | 01 | 181 | 174 | 129 | 131 | 104 | 100 |
| 2020 | 12 | 180 | 180 | 121 | 117 | 82 | 87 |
| 2020 | 11 | 201 | 199 | 158 | 171 | 114 | 117 |
| 2020 | 10 | 191 | 187 | 177 | 170 | 135 | 130 |
| 2020 | 09 | 169 | 170 | 119 | 119 | 89 | 95 |
| 2020 | 08 | 150 | 143 | 97 | 112 | 79 | 75 |
| 2020 | 07 | 139 | 137 | 110 | 118 | 94 | 91 |
| 2020 | 06 | 78 | 78 | 160 | 167 | 99 | 103 |
| 2020 | 05 | 0 | 0 | 0 | 0 | 0 | 0 |
| 2020 | 04 | 0 | 0 | 0 | 0 | 0 | 0 |
| 2020 | 03 | 0 | 0 | 0 | 0 | 0 | 0 |
| 2020 | 02 | 0 | 0 | 0 | 0 | 0 | 0 |
| 2020 | 01 | 0 | 0 | 0 | 0 | 0 | 0 |
| 2019 | 12 | 0 | 0 | 0 | 0 | 0 | 0 |
| 2019 | 11 | 0 | 0 | 0 | 0 | 0 | 0 |
| 2019 | 10 | 0 | 0 | 0 | 0 | 0 | 0 |
| 2019 | 09 | 0 | 0 | 0 | 0 | 0 | 0 |
| 2019 | 08 | 0 | 0 | 0 | 0 | 0 | 0 |
| 2019 | 07 | 0 | 0 | 0 | 0 | 0 | 0 |
| 2019 | 06 | 0 | 0 | 0 | 0 | 0 | 0 |
| 2019 | 05 | 0 | 0 | 0 | 0 | 0 | 0 |
| 2019 | 04 | 0 | 0 | 0 | 0 | 0 | 0 |
| 2019 | 03 | 0 | 0 | 0 | 0 | 0 | 0 |
| 2019 | 02 | 0 | 0 | 0 | 0 | 0 | 0 |
| 2019 | 01 | 0 | 0 | 0 | 0 | 0 | 0 |
| 2018 | 12 | 0 | 0 | 0 | 0 | 0 | 0 |
| 2018 | 11 | 0 | 0 | 0 | 0 | 0 | 0 |
| 2018 | 10 | 0 | 0 | 0 | 0 | 0 | 0 |
| 2018 | 09 | 0 | 0 | 0 | 0 | 0 | 0 |
| 2018 | 08 | 0 | 0 | 0 | 0 | 0 | 0 |
| 2018 | 07 | 0 | 0 | 0 | 0 | 0 | 0 |
| 2018 | 06 | 0 | 0 | 0 | 0 | 0 | 0 |
| 2018 | 05 | 0 | 0 | 0 | 0 | 0 | 0 |
Printed data for 84 months (rows) and 6 columns, for a total of 504 entries
Total time taken: 0.069 seconds, 0.068 for query, 0.001 for graph, and 0.000 for display